How to Interpret S21 S11 and Eye Diagrams for Quick Assessments
S21 tells you how much signal gets through. S11 tells you how much is reflected. The eye diagram tells you whether what gets through is still readable. A quick assessment reads all three, in that order, at the frequencies that matter for your data rate.
S21: insertion loss
S21 compares the signal leaving port 2 with the signal entering port 1, in dB against frequency. A perfect line would sit at 0 dB. A real one slopes down, because dielectric and conductor losses grow with frequency.
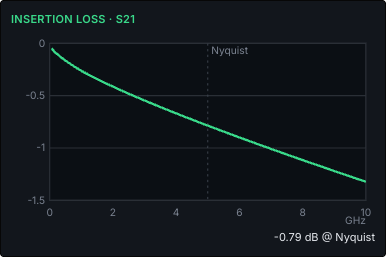
Three things to read:
- The value at Nyquist, half the bit rate for NRZ. Compare it with your budget.
- The shape. A smooth slope is normal. A sudden notch usually means a resonance, often a via stub.
- Ripple. Small regular wiggles mean reflections bouncing between two features. The ripple spacing tells you how far apart they are.
S11: return loss
S11 compares the reflected signal with the incident signal at port 1. More negative is better. It is driven by impedance mismatch: a line that differs from its termination reflects part of every edge.
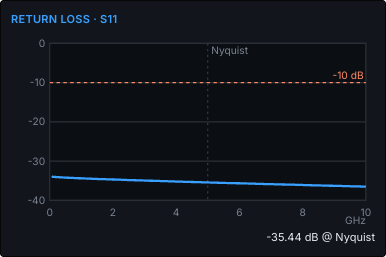
Three things to read:
- The level. Many interfaces want better than about −10 dB up to Nyquist; the dashed line marks it.
- Peaks. A peak in S11 often lines up with a dip in S21, and both point at the same feature.
- The trend. S11 that rises with frequency usually means a short capacitive or inductive feature, like a pad or a via.
A quick sanity check uses the reflection coefficient, Γ = (Z − Z0)/(Z + Z0). A 52.1 Ω line on a 50 Ω system reflects about 2%. A 57.3 Ω line reflects about 7%. Small numbers, but they add up along a channel.
The eye diagram
An eye diagram overlays many bit periods on top of each other. A clean, wide-open eye means the receiver has plenty of voltage and timing margin. Loss rounds the edges and squeezes the eye vertically. Reflections and crosstalk add fuzz. Jitter narrows it horizontally.
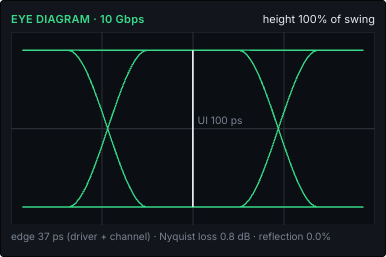
Three things to read:
- Eye height: the vertical opening at the centre, compared with receiver sensitivity.
- Eye width: the horizontal opening as a fraction of the unit interval.
- Crossings: lopsided crossings point at duty-cycle problems or reflections.
TDR: finding where the problem is
A TDR plot shows impedance against distance. It turns an S11 number into a location. A step up means higher impedance, a step down means lower, and the distance tells you where.
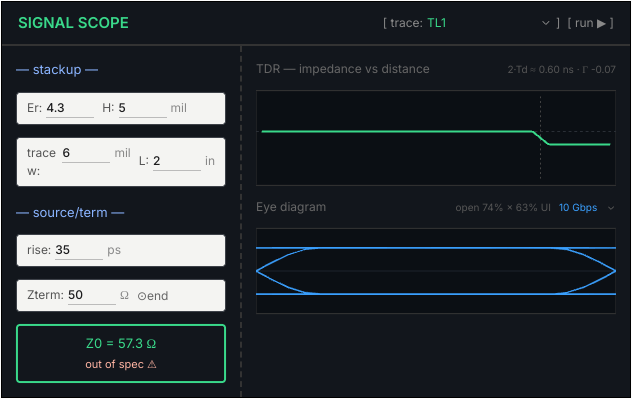
Here the 57.3 Ω trace steps down to the 50 Ω termination at the far end, which is exactly the 7% reflection the formula predicted.
A one-minute assessment
- Read S21 at Nyquist against the budget.
- Scan S21 for notches and ripple.
- Check S11 stays below about −10 dB to Nyquist.
- Confirm the eye is open in height and width, with margin.
- If anything looks off, use TDR to find where.
FlowSimLab draws all of these while you are still defining the trace, computing S21 and S11 from the line's ABCD matrix up to the signal's knee frequency. You can try them in the DSS workbench, and the full workflow is in Step by Step Channel Setup Using FlowSimLab DSS for High Speed Designs. When measured data disagrees with these plots, read Why Simulation vs Measurement Correlation Remains a Key Challenge for SI Teams.